
 Available in US
How F1 Betting Odds Work in the UK: Fractions, Decimals and Implied Probability
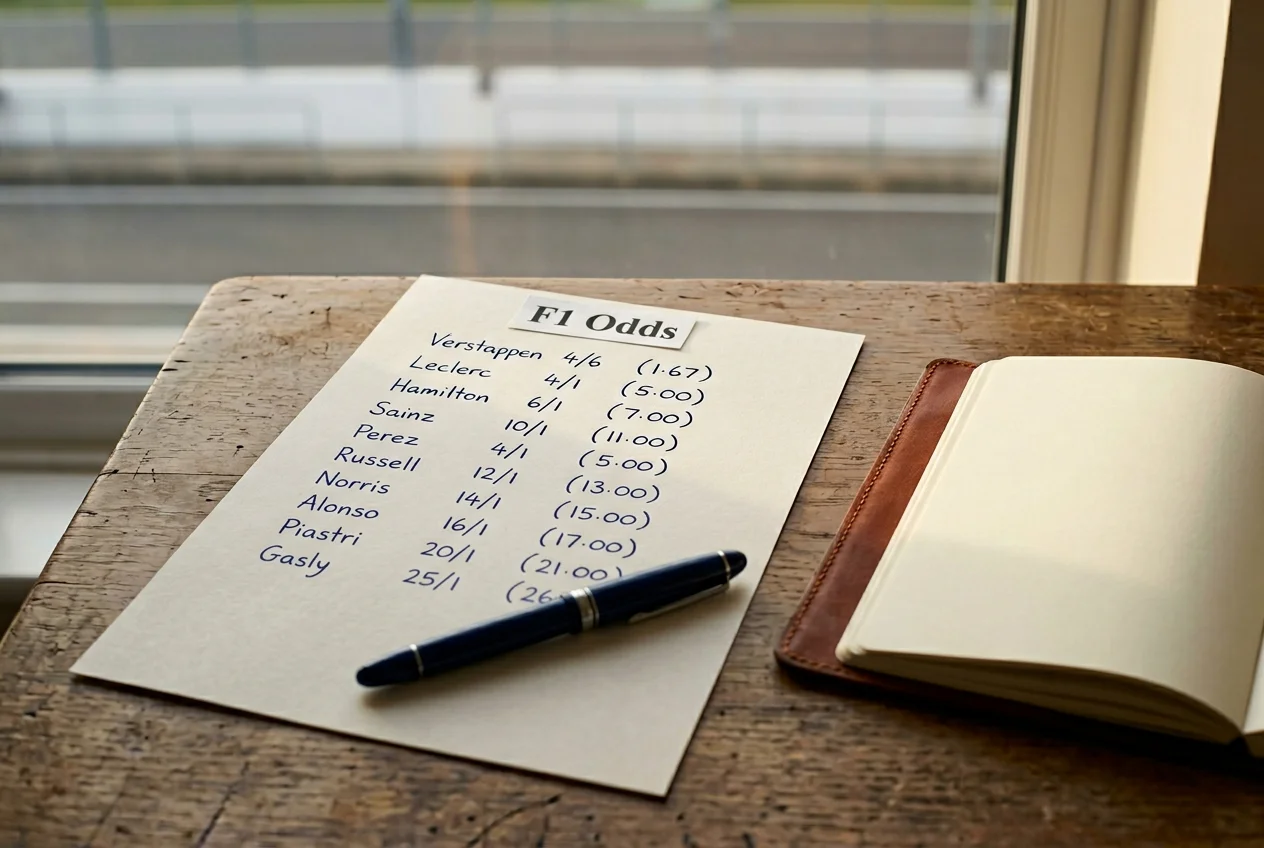
Two Number Systems, One Race
The first time I tried to explain odds to my partner, I drew two columns on a napkin and labelled them “British” and “everyone else”. She looked at it, asked which one was right, and I had to admit they were both right — they were just describing the same probability in different alphabets. That is the honest answer to the question this article exists to settle. Fractional and decimal odds are not competing systems with a winner. They are translations.
UK punters default to fractional. Open the F1 section of any UKGC-licensed sportsbook and the headline race-winner board reads in fractions: 4/6, 11/4, 10/1, 25/1. That convention survives because it predates the internet by about 200 years — it grew up on the rail at Newmarket and Cheltenham, was carried over to football coupons in the post-war years, and never had a reason to leave. The rest of the betting world — exchange traders, European books, Asian handicappers, every professional model — works in decimals. So if you bet seriously on F1, you need to be fluent in both, or you will repeatedly miss the cheaper price.
The third concept this article walks through is the one most retail punters never quite learn to read: implied probability. Implied probability is the percentage chance the price is suggesting. A 4/6 favourite is not just a price — it is a 60% probability claim, made by the operator who set the line. Understanding that the F1 race winner board carries a total implied probability of 110% to 120% across the field, not 100%, is the moment everything else about value betting starts to make sense. The 5–15% dispersion that you see across UK books on the same F1 wager only matters once you can read the percentage underneath the fraction. The rest of this article is the translator and the calculator, in plain English, with worked F1 examples at every stage.
See also: f1 bet for odds formats and UK market breakdowns.
Fractional Odds: The UK Default
Ladbrokes commanded 36.8% of UK gambling PPC market share by clicks in April 2026, with Sky Bet at 23.85% and William Hill at 9.87%. Those three operators — and every UKGC-licensed peer alongside them — present F1 race odds in fractions by default. The convention is stickier than the technology that displays it.
Reading the Fraction
A fractional price is simply a ratio of profit to stake. The number on the left is what the book pays you on top of your stake if the bet wins. The number on the right is what you have to stake to earn that profit. So 4/6 means stake six units, win four — for a £6 bet on a 4/6 driver, profit is £4 and total return is £10. 10/1 means stake one, win ten — £1 returns £11. 13/4 means stake four, win thirteen — £4 returns £17.
Worked Example: F1 Race Winner
Take a typical 2026-spec European round. The race-winner board lists the favourite at 4/6, the second favourite at 11/4, two midfield contenders at 10/1, and a long-shot at 33/1. A £10 stake on the 4/6 favourite returns £16.67 total — profit of £6.67. The same £10 on the 11/4 second favourite returns £37.50 — profit of £27.50. On the 10/1 contender, £10 returns £110. On the 33/1 long-shot, £10 returns £340. The fractions tell you what you take home; they say nothing yet about how likely each outcome actually is.
Why the UK Kept Fractions
The historical answer is racecourse settling. When bookies stood on grass at Epsom in the 1840s, they shouted prices and chalked them on slates, and a fraction was the fastest way to communicate a ratio with a piece of chalk. The modern answer is recognition. UK punters are fluent in 11/4 the way Americans are fluent in money lines — it is the language they grew up with, and switching to decimal feels like switching units of currency. Operators preserve the default to avoid alienating their core audience. Almost every UK F1 product I have placed in the last eight years offers a decimal toggle in the user settings, but the toggle defaults to off.
Half-Point Fractions
Fractions also handle half-integer prices with unhelpful elegance. A 5/2 driver returns five units profit on a two-unit stake — equivalent to 3.50 in decimal. A 9/4 driver returns nine units on four — equivalent to 3.25. These half-step prices appear most often in F1 podium and points-finish markets, where the underlying probability lands between obvious round numbers, and they are the most common point of confusion for newer punters. The fix is mental arithmetic, not a different system.
Decimal Odds and Conversion
Decimal odds were not invented to confuse British punters. They were invented to make accumulators readable. UK online betting GGY hit £1.42 billion in Q2 2025, growing 8% year-on-year, and almost every penny of that growth came through mobile platforms where on-screen calculation matters more than racecourse tradition. Decimal is the mobile-era format.
Reading the Decimal
A decimal price represents the total return — stake plus profit — per unit staked. So 1.67 means a £1 stake returns £1.67 in total, including the original £1. 11.0 means £1 returns £11. 4.25 means £1 returns £4.25. The advantage is immediate arithmetic: total return is stake multiplied by the decimal, full stop. There is no separate “plus the stake back” step to remember.
Converting Fractional to Decimal
The formula is straightforward. Divide the left number of the fraction by the right, then add 1. So 4/6 becomes 4 divided by 6, which is 0.67, plus 1 equals 1.67. 11/4 becomes 11 divided by 4 equals 2.75, plus 1 equals 3.75. 10/1 becomes 10.0 plus 1 equals 11.0. 33/1 becomes 33.0 plus 1 equals 34.0. Even-money — written 1/1 or “evens” — is exactly 2.00 in decimal.
Worked Example: F1 Race Winner in Decimal
Take the same race-winner board from earlier. The 4/6 favourite is 1.67 in decimal. The 11/4 second favourite is 3.75. The 10/1 contender is 11.0. The 33/1 long-shot is 34.0. A £10 stake on the 1.67 favourite returns £16.70 — the same as the fractional calculation, with one fewer step to do in your head. On 3.75, £10 returns £37.50. On 11.0, £10 returns £110. On 34.0, £10 returns £340. The numbers are identical; the path to them is shorter.
Where Decimal Wins
Accumulators are where decimal becomes essential. To calculate the total odds of a four-leg builder in fractional, you have to convert every leg to decimal in your head anyway, multiply them, and convert back. To calculate the same builder in decimal, you just multiply: 1.67 × 3.75 × 11.0 × 2.10 = 144.5, which converts to roughly 143/1 in fractional. Every accumulator price on a UK book’s display has been calculated in decimal internally and then displayed in fractional. Toggling to decimal in your settings just shows you what the engine is already doing. For F1 bet builders specifically — where you might combine race winner, podium, pole, and fastest lap on one ticket — the decimal display saves real time.
When to Stick With Fractional
For single bets, particularly on short prices, fractional retains an information advantage. A 6/4 price tells you instantly that you risk four to win six — a useful frame for stake sizing. The equivalent 2.50 decimal price requires a subtraction to extract the same fact. So I personally read fractional for singles and decimal for accumulators and value comparisons across operators. The toggle is in your settings; use both.
Implied Probability: The Number Behind the Price
Once you can convert between fractions and decimals fluently, the most important next step is reading the third number that no operator displays on the board — implied probability. This is the percentage chance the odds are claiming. It is the only number that matters when you are deciding whether a price represents value.
The Formula
Implied probability equals 1 divided by the decimal odds. That is it. A 1.67 favourite has an implied probability of 1 ÷ 1.67 = 0.599, or 59.9%. A 3.75 second favourite is 1 ÷ 3.75 = 0.267, or 26.7%. A 11.0 long-shot is 1 ÷ 11.0 = 0.091, or 9.1%. A 34.0 deep long-shot is 1 ÷ 34.0 = 0.029, or 2.9%. Memorise the formula; it is the foundation of every value calculation in F1 betting.
Worked Example: Reading a Full F1 Race Card
Take a 20-driver race winner market with the following decimal prices: favourite 1.67 (59.9%), second 3.75 (26.7%), third 6.0 (16.7%), fourth 11.0 (9.1%), fifth 13.0 (7.7%), sixth 21.0 (4.8%), and so on, with the back of the grid running 81.0 to 251.0 (1.2% to 0.4%). Add up all the implied probabilities across the board and you do not get 100%. You get something closer to 115% to 120%. That extra 15% to 20% is the bookmaker’s margin — the overround — and the next section walks through how to extract it.
Reading Implied Probability for Different Markets
Different F1 markets carry different total implied probabilities, and reading them correctly tells you where the operator’s edge is widest. A two-driver head-to-head priced at 5/6 and 5/6 (1.83 each) has an implied probability of 54.6% on each side — 109.2% total — which is a 9.2% overround on a binary market. A podium finish market across 20 drivers might run at 130% to 140% total implied probability, which is a wider margin reflecting the operator’s higher uncertainty on a three-slot market. Once you can read these numbers, you can tell at a glance which F1 markets a given book has priced sharply and which they are quietly milking.
Comparing Your Probability Against the Implied Probability
This is where value betting starts. If your own analysis of free practice, qualifying form, and circuit history says a driver has a 35% chance of winning a race, and the implied probability on his price is 26.7%, you have an edge — the market is underpricing him relative to your view. If your view says 20% and the price implies 26.7%, the market is overpricing him and you should pass. The single most useful habit a UK F1 punter can develop is calculating implied probability before placing every bet, and comparing it against an honest estimate of your own probability.
Overround and the Bookmaker Margin
If you have ever wondered why bookmakers stay in business, the answer is in this section. The overround — sometimes called vigorish, vig, or “the juice” — is the percentage by which an operator’s total implied probabilities exceed 100%. It is the structural margin built into every market, and on F1 it runs higher than on most mainstream sports.
How to Calculate Overround
The calculation is simple: sum the implied probabilities across all outcomes in a market, then subtract 100. A two-way head-to-head priced at 5/6 and 5/6 gives implied probabilities of 54.6% and 54.6%, summing to 109.2%. Overround is 9.2%. A 20-driver race winner market with implied probabilities summing to 117% carries an overround of 17%. The bigger the field and the more uncertain the outcome, the wider the overround tends to run.
Typical F1 Overrounds
A few benchmarks from the markets I price daily. Race winner markets on a settled 2025-spec European round usually carry overrounds of 110% to 120% — pricing closer to the 110% end on Saudi or Bahrain, where the favourite is firm, and toward 120% at Monaco, where every driver in the field has a non-trivial chance once the safety car arrives. The 2026 reset year has widened these by another 2% to 5% on average across UK books, because pricing uncertainty is higher. Podium markets run 130% to 145%, points-finish markets 140% to 160%, and prop markets like first retirement can hit 200%+. Head-to-heads, predictably, are the tightest — typically 105% to 110%, sometimes lower on the sharpest exchange-aligned operators.
Why F1 Overrounds Are Higher Than Football
A Premier League match-result book runs about 104% to 106% overround in liquid hours. The equivalent F1 race-winner market runs 110% to 120%. The two-times factor is partly down to liquidity — F1 takes far less weekly turnover than top-flight football, so operators need a wider margin per pound staked to clear their pricing costs. It is also partly down to volatility. The 2026 reset and the regulatory uncertainty around the new power units make F1 a sport where pricing engines can be genuinely wrong by 15% on a Sunday afternoon, and operators pad the book accordingly.
Reading the Overround as a Punter
The practical implication is that you are paying more, per pound staked, on an F1 race-winner ticket than you would on a Premier League match — but you are also looking at a market that is harder for operators to price accurately, which means more genuine value opportunities for a careful punter. The two facts pull in opposite directions. The way to balance them is to focus your stake on markets where the overround is lowest and the operator’s analytical advantage is weakest — head-to-heads, qualifying H2H, and points-finish on a clear weather day, all of which carry overrounds in the 105% to 115% band.
Overround Across Multiple Bookmakers
The same race-winner market can show wildly different overrounds across UK books on the same Sunday. One operator might price the field at 112%, another at 121% — and the punter who shops the line is effectively choosing a 9% discount on every pound staked. This is one of the strongest arguments for maintaining accounts at three or four UKGC-licensed operators rather than concentrating loyalty in one. The price-shopping discipline is worth real money over a 24-race season.
Price Dispersion Across UK Books
The single most actionable number in F1 betting is this: the same wager on the same driver in the same race can vary by 5% to 15% between UK bookmakers. That is not a marketing claim or a tip-sheet flourish — it is the structural reality of a fragmented sports-betting market where each operator runs its own pricing engine off different inputs and different risk appetites. The punter who learns to read those gaps will outperform the punter who does not, regardless of analytical edge.
Why Prices Diverge
Three factors drive the dispersion. First, each operator weights different inputs — one book might lean heavily on free-practice pace, another on qualifying odds from the previous round, a third on raw machine-learning models with limited human override. Second, books have different liability positions on each driver heading into the weekend — if Book A has already taken £40 000 on a mid-pack outsider during the week, Book A’s price on that driver will be visibly shorter than Book B’s by Sunday morning. Third, books target different demographics; an operator whose core audience is recreational football punters will sit slightly behind the sharp F1 market because they care less about the F1 line.
Worked Example: Same Driver, Three Books
Take a typical 2026 European weekend. Driver X opens at 6/1 on Book A on Wednesday, 5/1 on Book B, and 11/2 on Book C. Implied probabilities are 14.3%, 16.7%, and 15.4%. By Saturday after qualifying, the prices have moved: A is at 9/2, B at 5/1, C at 11/2. The Book A price has compressed because their algorithm trusts qualifying pace; Book C has not moved at all because their model weights race-pace data they collected on Friday. The best available price on the punter’s spreadsheet is 11/2 — Book C — and a punter who only checks Book A is leaving 6.1% expected value on the table.
When Dispersion Is Widest
The 5–15% dispersion band is not constant across the season. It widens in two predictable scenarios: regulation reset years (like 2026) where operators have less historical model fit, and at street circuits like Monaco and Singapore where qualifying pace is a poor predictor of race pace. It narrows on aero-driven dry-weather rounds at familiar circuits, where every model in the market converges on the same answer.
The Line-Shopping Discipline
Maintaining accounts at four UKGC-licensed operators and checking the F1 board on all four before placing every bet is the most mechanical and underrated edge in F1 betting. The discipline takes maybe 90 seconds per wager. Over a 24-race season, with three bets per weekend, that is roughly 30 hours of price-shopping for what might be a 4% to 7% lift in long-run return. The arithmetic is unforgiving on this point: 30 hours of work, almost always profitable. For deeper coverage of how line-shopping interacts with bet builders, my F1 bet builder guide walks through where the dispersion compounds.
Value Betting and the Favourite Bias
David Forrest, the University of Liverpool economist, told a UK Parliament Select Committee that in much of Europe in-play betting now accounts for about 70% of sports-betting gross gaming yield, though Britain’s share is still slightly lower. The reason that statistic matters here is what it implies about where the value is in F1: in-running, in head-to-head markets, and almost never on the popular favourite at the front of the race-winner board.
Why the Favourite Is Usually Overpriced
F1 favourites carry what economists call a public bias premium. A retail punter scanning the race-winner board on Sunday morning sees the favourite at 4/6 and feels safe — and books know it, and they price accordingly. The favourite’s implied probability is almost always 2% to 5% higher than the model’s fair price would suggest. Multiply that across 24 races and the punter who instinctively backs every favourite is fighting a structural headwind worth roughly 1% to 3% of total turnover.
Where the Value Lives
The midfield is where the maths starts to favour the careful punter. A driver priced at 10/1 to 25/1 in the race-winner market is often genuinely closer to 12/1 to 30/1 in fair-price terms — the operator has stretched the price because public money rarely lands on names that don’t appear in the top three. The mid-pack H2H market is similar: when neither driver is a household name, the public bias premium dissolves, and the prices converge close to a true 50/50 split with only the overround as drag.
Value as Calculation, Not Hunch
The trap is calling something “value” because it feels like a long-shot worth backing. Real value is a calculation: your own probability minus the implied probability. If you assign a 30% chance to a 4/1 driver (implied 20%), the edge is 10 percentage points and the bet is value. If you assign 20% to the same 4/1 driver, the edge is zero and the bet is no different from coin-flipping at the bookmaker’s table. The discipline is to write the number down before you check the price, not after — otherwise the price anchors your estimate and the calculation becomes circular.
Where I Personally Find Value
Eight years in, the value I find most consistently is in qualifying H2H markets on Saturday afternoon, and in points-finish markets on the third or fourth favourite at races where weather is forecast to be variable. Both are markets where my private model genuinely disagrees with the public-anchored price often enough to compound over a season. Both are markets where the overround sits below the F1 average. And both are markets where the rare F1 punter who actually watches free practice can build a measurable edge against an operator pricing 24 sports simultaneously.
Tools and Calculators
Every UK book includes a built-in bet calculator. It is usually buried two clicks deep in the help menu and almost no punter uses it. The reason I bring this up is that the calculator is the only tool you actually need — everything else, including the third-party odds-conversion sites and the comparison aggregators, is a wrapper on the same two formulas this article has already walked through.
What a calculator does well is handle multi-leg accumulators where the arithmetic gets tedious. A four-leg builder with prices of 1.67, 3.75, 11.0, and 2.10 in decimal multiplies to 144.5 — close to 143/1 in fractional. Doing that in your head is possible, but at speed and under pressure it is easier to miskey one decimal place. Use the calculator.
What calculators do badly is implied probability and overround analysis. Most operator-side calculators show you total return but not implied probability. So for value calculations, build your own spreadsheet — three columns: price in decimal, implied probability (1 ÷ decimal), your own probability — and a fourth column showing the difference. That is all the apparatus a serious F1 punter needs. Exchange-side aggregators that show overround across multiple operators are useful for line-shopping but should never be trusted blindly — the aggregator’s “best price” is often a heavily limited line that the underlying operator will not honour at retail stake sizes. Always check the maximum stake at the source operator before treating an aggregator price as gospel.
See also: learn how rule changes shift the odds in our 2026 regulations impact analysis.
Frequently Asked Questions
Three questions about F1 odds come up more often than any others, and they all bite where the maths is least intuitive. I have answered them with the level of arithmetic detail that operator help pages tend to skip.
Is 4/6 the same as 1.67 in decimal?
Yes — they are the same price expressed in two different formats. The conversion is to divide the left side of the fraction by the right and add 1. So 4 divided by 6 equals 0.667, plus 1 equals 1.667, which rounds to 1.67 on most operator displays. Both formats describe an implied probability of about 60% — the favourite is being priced as a six-in-ten chance to win. A £10 stake at 4/6 returns the same £16.67 as a £10 stake at 1.67. The only practical difference between the two is which format your operator displays by default, and almost all UK books let you toggle between them in your account settings.
Do all UK bookmakers show the same F1 odds?
No — and the differences are substantial. The same race winner, podium, or head-to-head wager typically varies by 5% to 15% across UKGC-licensed operators on the same Sunday. The variation reflects different pricing models, different liability positions per driver, and different risk appetites at each book. Maintaining accounts at three or four UK operators and checking the line on all of them before placing every bet is the single most reliable way to add measurable expected value to a long F1 betting season. The discipline of price-shopping is more valuable than any tip-sheet or model.
What"s a good overround for an F1 race winner market?
Anything below 115% is competitive on a 20-driver F1 race winner market. The typical range across UK books runs 110% to 120%, with the sharpest operators at the lower end and recreational-focused books at the higher end. In 2026, with the regulation reset compressing the top of the grid, overrounds widened by another 2% to 5% on average across the market — pricing engines have less historical fit and operators padded the book to compensate. To check the overround yourself, sum the implied probabilities (1 divided by each decimal price) across all drivers and subtract 100. If the total is above 120%, the operator is taking a relatively wide margin and you should price-shop elsewhere.
